empty
28.09.2022 02:10 PM
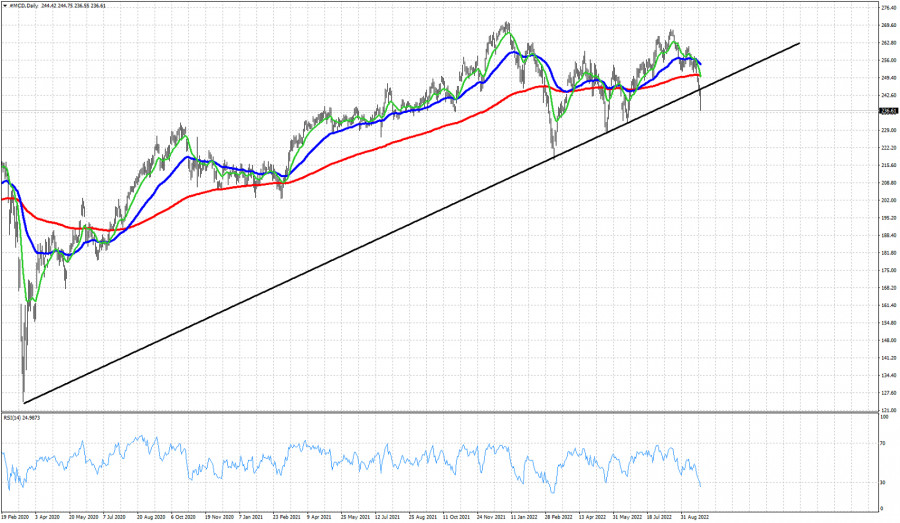
Simple trend analysis on MCD stock price

This image is no longer relevant

Black line- support trend line

Red line- 200 Exponential MA

Blue line- 50 Exponential MA

Green line - 13 Exponential MA

Recent price action in MCD has been extremely bearish. There are increased chances that the upward move from 2020 lows is complete and we should at least see a corrective pull back. Price has broken below the key upward sloping resistance trend line after being tested twice. The importance of the trend line was confirmed by previous price action. Price not only has broken below the trend line support, in the Daily chart we also see price below all three MA indicators. Apart from the 200 DMA, the other DMA are negatively sloped and the 13 DMA has crossed below the 5DMA. The Daily RSI has just reached oversold conditions. Current chart, points to more downside implying that MCD should head towards $200 or lower.

Select timeframe
5
min
15
min
30
min
1
hour
4
hours
1
day
1
week
Earn on cryptocurrency rate changes with InstaForex
Download MetaTrader 4 and open your first trade
  • Grand Choice
    Contest by
    InstaForex
    InstaForex always strives to help you
    fulfill your biggest dreams.
    JOIN CONTEST

Recommended Stories

US market rallies as Fed holds rates steady

S&P500 Overview for March 20 The US market rallied as the Fed left interest rates unchanged. Key US indices on Wednesday: Dow: +0.9%, NASDAQ: +1.4%, S&P 500: +1.1% (S&P

Jozef Kovach 11:19 2025-03-20 UTC+2

US stock market on March 20: S&P 500 and Nasdaq regain their footing

US stock indices ended the day with solid gains. The S&P 500 climbed by 1.1% and the Nasdaq 100 closed 1.41% up. At the moment, S&P 500 futures

Jakub Novak 09:30 2025-03-20 UTC+2

S&P 500 Forecast for March 20, 2025

The S&P 500 experienced a positive trading session yesterday and has started today on a strong note. However, the entire rally since March 14 still appears to be a correction

Laurie Bailey 03:37 2025-03-20 UTC+2

US market overview: pullback after growth. Focus on Fed. No rate change expected

S&P 500 Market overview on March 19 US Market: Pullback. Consolidation. Focus on Fed. Major US indices on Tuesday: Dow -0.6%, NASDAQ -1.7%, S&P 500 -1.1%, S&P 500 5,614, range

Jozef Kovach 10:57 2025-03-19 UTC+2

Stock market overview on March 18: S&P 500 and Nasdaq rise for second day

US stock indices closed with solid gains yesterday. The S&P 500 rose by 0.64%, while the Nasdaq 100 added 0.31%. Asian stocks are also up for the third day, driven

Jakub Novak 12:11 2025-03-18 UTC+2

US stock market: two days of gains from support levels

S&P500 US stock market: two days of gains from support levels Snapshot of major US indices on Monday: Dow Jones: +0.9% NASDAQ: +0.3% S&P 500: +0.6% (closed at 5,675; range

Jozef Kovach 11:18 2025-03-18 UTC+2

Stock market analysis on March 17: S&P 500 and Nasdaq remain under pressure

Futures on US stock indices declined after Treasury Secretary Scott Bessent called the recent market drop "favorable," reinforcing expectations that the Trump administration is unlikely to intervene to stop

Jakub Novak 13:49 2025-03-17 UTC+2

US Market: strong support formed for S&P 500

S&P 500 Market review on March 17 US Market: strong support formed for S&P 500 Major US indexes on Friday: Dow +1.7%, Nasdaq +2.6%, S&P 500 +2.1%, S&P

Jozef Kovach 13:21 2025-03-17 UTC+2

Stock Market on March 14th: S&P 500 and NASDAQ Indexes Continue to Decline

Futures on the S&P 500 and NASDAQ stock indices continued their significant decline, returning to a bearish scenario.Asian stocks, along with futures on U.S. and European stock indices, rose during

Jakub Novak 13:01 2025-03-14 UTC+2

Donald Trump Is Just Getting Started

The 24-hour chart wave structure for #SPX appears relatively clear. The first key observation is the global five-wave structure, which is so extensive that it doesn't even fit into

Chin Zhao 12:04 2025-03-14 UTC+2
Can't speak right now?
Ask your question in the chat.
Widget callback