EUR/USD 5-Minute Analysis
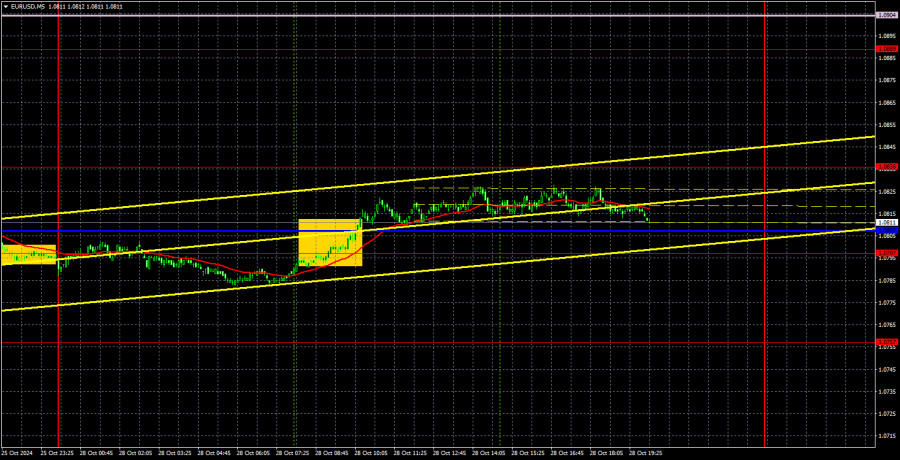
The EUR/USD currency pair attempted an upward correction on Monday but failed again. Looking closely at the illustration above, you can see that despite efforts over the past five days to move upward, each new high is lower than the previous one. This means that there is currently no corrective movement. We warned that breaking the trendline does not guarantee the start of a correction and could be a false breakout. The trendline has recently been very close to the price, so almost any upward move could break it. If not for the significant data scheduled for release in the Eurozone and the U.S. this week, we would have said that the euro would continue falling without any correction.
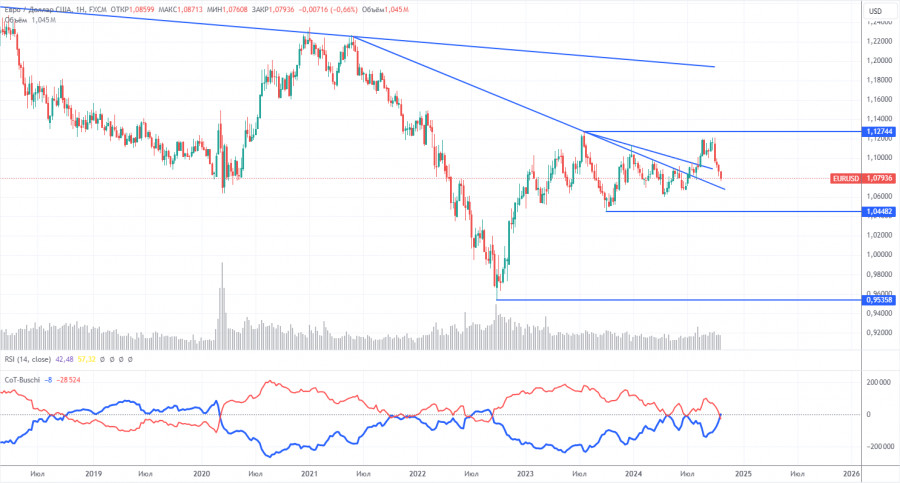
As mentioned before, the euro is highly overbought and overvalued and will likely continue declining in the medium term. The minimum target is 1.0435. Reaching this target would mean that the price on the weekly time frame has reached the lower boundary of the horizontal channel. The overall trend is still downward. The market has been correcting the pair upward for two years due to the Federal Reserve's monetary easing. Even without external factors, restoring a fair EUR/USD exchange rate is necessary. Therefore, we expect a decline in the euro under almost any scenario.
Only one trading signal was generated in the 5-minute time frame yesterday, but Monday's volatility was very weak, and there was no significant fundamental or macroeconomic data. After consolidating above the critical line, traders could open long positions, but they likely saw no gain or loss, as the price did not move significantly upwards nor fall below the Kijun-sen line by the end of the day. This week, the pair's fate will largely depend on macroeconomic releases.
COT Report Analysis
The latest COT report, dated October 22, shows that the net position of non-commercial traders has remained bullish for a long time, and the bears' recent attempt to gain dominance failed. However, last week saw a sharp increase in the number of short positions opened by professional traders, and the net position became negative for the first time in a while, indicating that the euro is now sold more frequently than bought.
We still see no fundamental reasons for euro strength, and technical analysis suggests that the price is in a consolidation zone – essentially flat. The weekly time frame shows that since December 2022, the pair has been trading between levels 1.0448 and 1.1274, extending from a seven-month flat phase into an 18-month phase. Thus, a further decline remains more likely.
The red and blue lines have crossed and reversed their relative positions. During the last report week, the number of longs in the non-commercial group decreased by 16,200, while shorts increased by 29,500, causing the net position to drop by 45,700. The euro still has strong downward potential.
EUR/USD 1-Hour Analysis
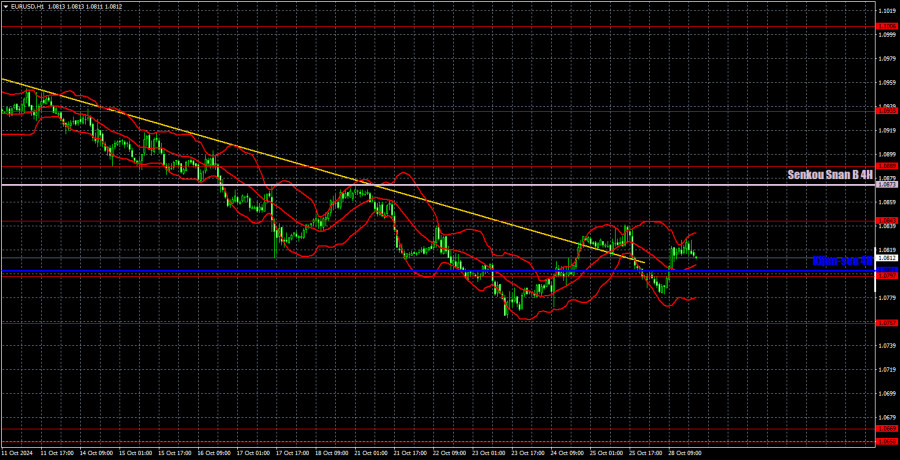
On the hourly time frame, the pair continues to trend downward, which may mark the beginning of a new prolonged downtrend. There's little reason to discuss fundamental or macroeconomic reasons for a new dollar decline – they do not exist. In the medium term, we anticipate nothing but further euro depreciation. While a short-term correction is possible, the market currently shows little interest in buying euros, and there are insufficient technical signals to expect an upward move.
For October 29, we highlight the following trading levels: 1.0658-1.0669, 1.0757, 1.0797, 1.0843, 1.0889, 1.0935, 1.1006, 1.1092, and 1.1147, as well as the Senkou Span B (1.0873) and Kijun-sen (1.0801) lines. The Ichimoku indicator lines can move throughout the day, which should be considered when identifying trading signals. Remember to set a Stop Loss to break even if the price moves 15 pips in the intended direction to protect against potential losses if the signal proves false.
On Tuesday, no significant events are scheduled in the Eurozone, while in the U.S., the JOLTs report on job openings will be released. This is a medium-importance report but could be a starting point for price movement this week.
Chart Explanations:
Support and resistance levels: thick red lines around which movement may end. They are not sources of trading signals.
Kijun-sen and Senkou Span B lines: Ichimoku indicator lines transferred from the 4-hour to the 1-hour timeframe. These are strong lines.
Extreme levels: thin red lines where the price previously rebounded. They are sources of trading signals.
Yellow lines: Trend lines, trend channels, and other technical patterns.
Indicator 1 on COT charts: The net position size for each category of traders.


