

сила сигнала 1 из 5
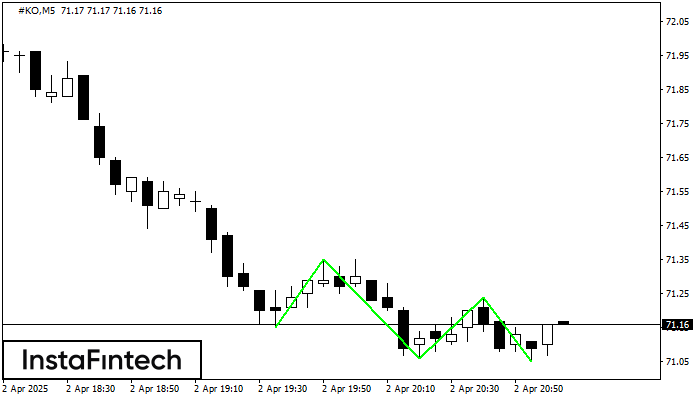
По торговому инструменту #KO на M5 была сформирована графическая фигура «Тройное дно» с характеристиками: Уровень сопротивления 71.24; Уровень поддержки 71.05; Ширина 19 пунктов. В случае пробоя уровня сопротивления 71.35 котировка, скорее всего, продолжит восходящее движение как минимум на 29 пунктов.
Таймфреймы М5 и М15 могут иметь больше ложных точек входа.
Шунингдек кўринг
- Все
- Вымпел
- Голова и плечи
- Двойная вершина
- Прямоугольник
- Треугольник
- Тройная вершина
- Флаг
- Все
- #AAPL
- #AMZN
- #Bitcoin
- #EBAY
- #FB
- #GOOG
- #INTC
- #KO
- #MA
- #MCD
- #MSFT
- #NTDOY
- #PEP
- #TSLA
- #TWTR
- AUDCAD
- AUDCHF
- AUDJPY
- AUDUSD
- EURCAD
- EURCHF
- EURGBP
- EURJPY
- EURNZD
- EURRUB
- EURUSD
- GBPAUD
- GBPCHF
- GBPJPY
- GBPUSD
- GOLD
- NZDCAD
- NZDCHF
- NZDJPY
- NZDUSD
- SILVER
- USDCAD
- USDCHF
- USDJPY
- USDRUB
- Все
- M5
- M15
- M30
- H1
- D1
- Все
- Покупка
- Продажа
- Все
- 1
- 2
- 3
- 4
- 5

According to the chart of M5, GBPCHF formed the Bearish Symmetrical Triangle pattern. Trading recommendations: A breach of the lower border 1.0783 is likely to encourage a continuation
The M5 and M15 time frames may have more false entry points.
Open chart in a new window
The Triple Bottom pattern has formed on the chart of USDJPY M15. Features of the pattern: The lower line of the pattern has coordinates 140.99 with the upper limit 140.99/140.92
The M5 and M15 time frames may have more false entry points.
Open chart in a new window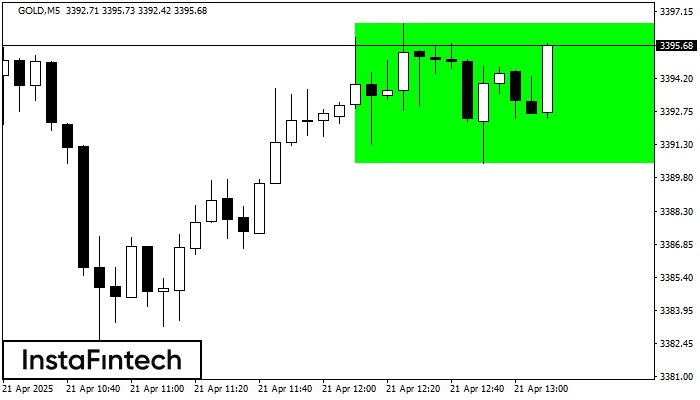
According to the chart of M5, GOLD formed the Bullish Rectangle. This type of a pattern indicates a trend continuation. It consists of two levels: resistance 3396.64 and support 3390.42
The M5 and M15 time frames may have more false entry points.
Open chart in a new window


