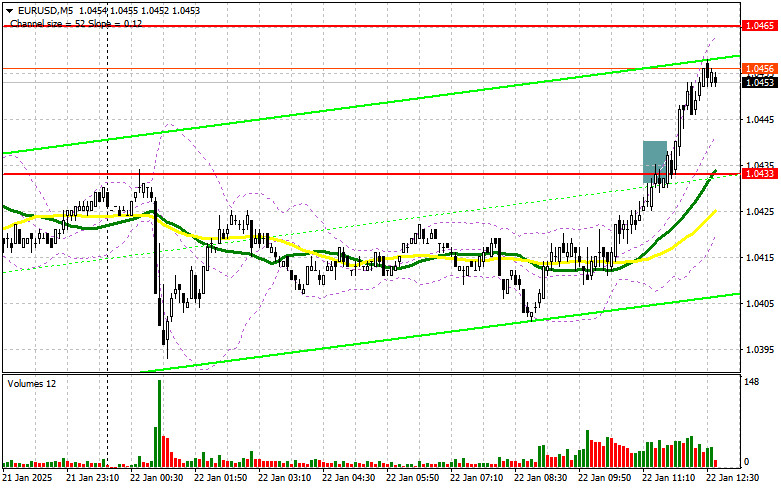
In my morning forecast, I highlighted the 1.0433 level and planned to make market entry decisions around it. Let's review the 5-minute chart to see what happened. The rise and formation of a false breakout near 1.0433 led to an entry point for selling the euro, but no significant decline materialized, resulting in a loss. The technical outlook for the second half of the day has been revised.
To Open Long Positions on EUR/USD
Expectations that Trump will not aggressively impose high tariffs immediately after taking office continue to fuel demand for risk assets, allowing euro buyers to reach a new weekly high today. This afternoon, only data on the US Leading Indicators Index will be published, which is unlikely to significantly impact the EUR/USD pair's direction, so the chances of continued euro recovery are fairly high.
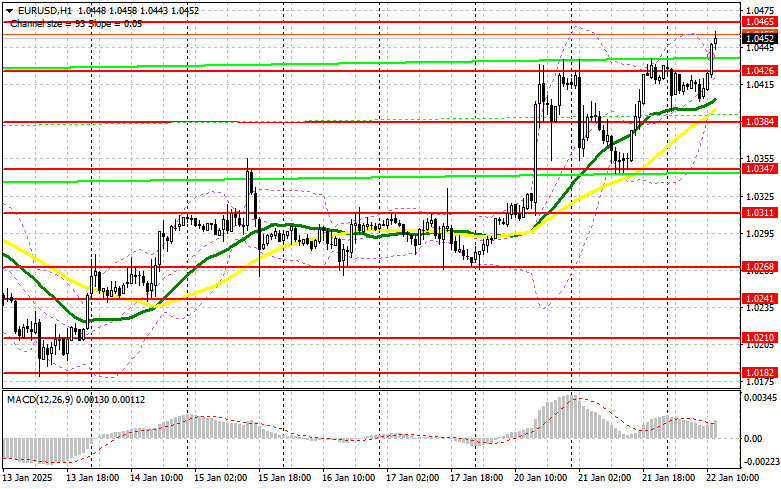
I'll consider buying the euro only after a decline and the formation of a false breakout near the new support at 1.0426, formed during the first half of the day. This will provide a good market entry point and a rise toward the 1.0465 resistance level. A breakout and retest of this range will confirm a proper entry point for buying, aiming for 1.0501. The final target will be the 1.0534 level, where I'll fix profits. If EUR/USD declines and shows no activity near 1.0426 this afternoon, selling pressure will return, and sellers may push the pair toward 1.0384. I'll only act to buy euros after a false breakout forms there. I plan to open long positions immediately on a rebound from 1.0347, targeting an intraday correction of 30–35 points.
To Open Short Positions on EUR/USD
Sellers remain cautious, which may lead to adverse outcomes. Closing the day above 1.0425 could signal the development of a new bullish trend, which bears should avoid. If the euro experiences another wave of growth, only a false breakout near 1.0465 will convince me of the presence of major players in the market, providing an entry point for short positions with a potential drop to the 1.0426 support. A breakout and consolidation below this range, along with a retest from below, would offer another selling opportunity targeting the 1.0384 level, where moving averages currently favor the bulls. The final target will be the 1.0347 level, where I plan to fix profits.If EUR/USD rises this afternoon and bears fail to act near 1.0465, where moving averages favor sellers, I'll postpone short positions until testing the next resistance at 1.0501. I'll sell there only after an unsuccessful consolidation. If there's no downward movement there either, I plan to open short positions immediately on a rebound from 1.0534, targeting an intraday downward correction of 30–35 points.

Commitment of Traders (COT) Report
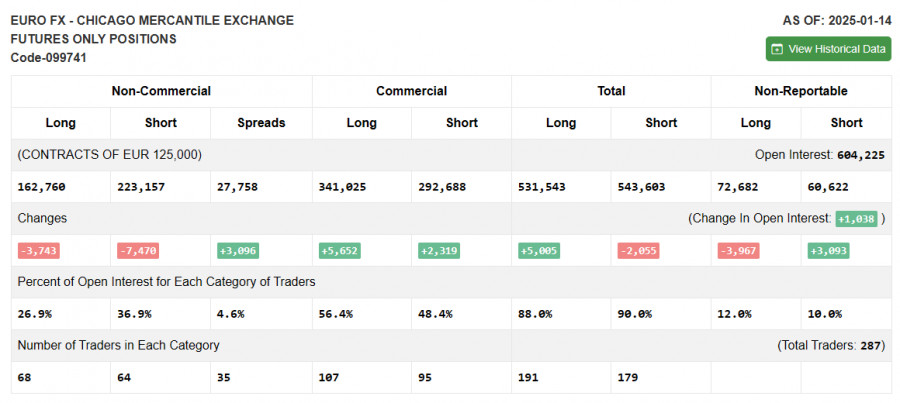
The January 14 COT report showed reductions in both short and long positions. With growing uncertainty regarding the future Federal Reserve policy, traders trimmed some positions. Trump's inauguration added pessimism, but the overall balance of power hasn't changed significantly. The report indicated that long non-commercial positions fell by 3,743 to 162,760, while short non-commercial positions dropped by 7,470 to 223,157. As a result, the gap between long and short positions widened by 3,096.
Indicator Signals
Moving AveragesTrading occurs above the 30- and 50-day moving averages, indicating continued euro growth.Note: The author analyzes the moving averages on the hourly H1 chart, which differs from the classical definition on the D1 daily chart.
Bollinger BandsIn the event of a decline, the lower boundary of the indicator at 1.0384 will act as support.
Indicator Descriptions
- Moving Average: Determines the current trend by smoothing volatility and noise. Period: 50 (yellow on the chart), 30 (green on the chart).
- MACD: Moving Average Convergence/Divergence. Fast EMA – Period: 12, Slow EMA – Period: 26, SMA – Period: 9.
- Bollinger Bands: Tracks price volatility. Period: 20.
- Non-Commercial Traders: Speculators such as individual traders, hedge funds, and major institutions using the futures market for speculative purposes.
- Long Non-Commercial Positions: Total long positions held by non-commercial traders.
- Short Non-Commercial Positions: Total short positions held by non-commercial traders.
- Net Non-Commercial Position: The difference between short and long positions held by non-commercial traders.


